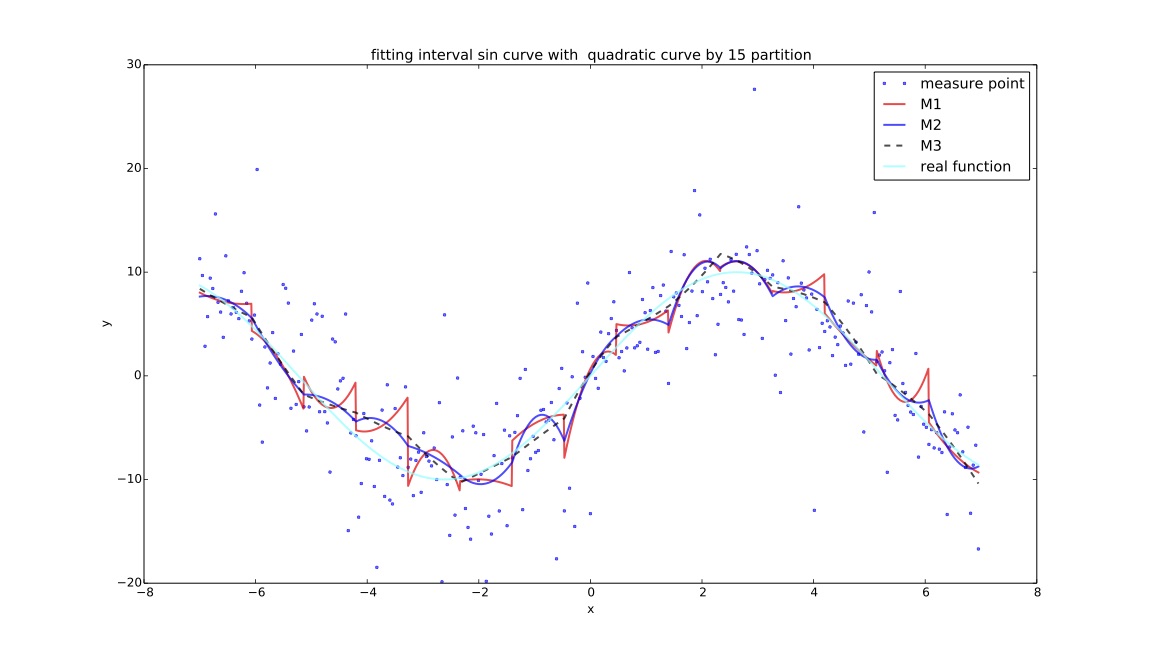
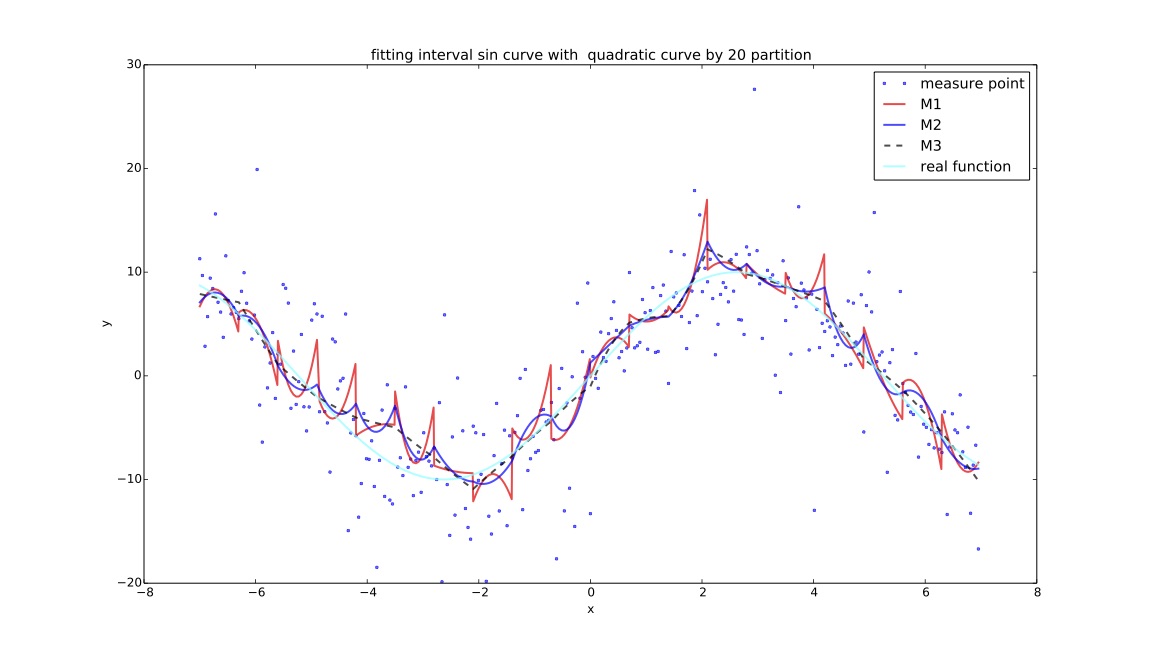
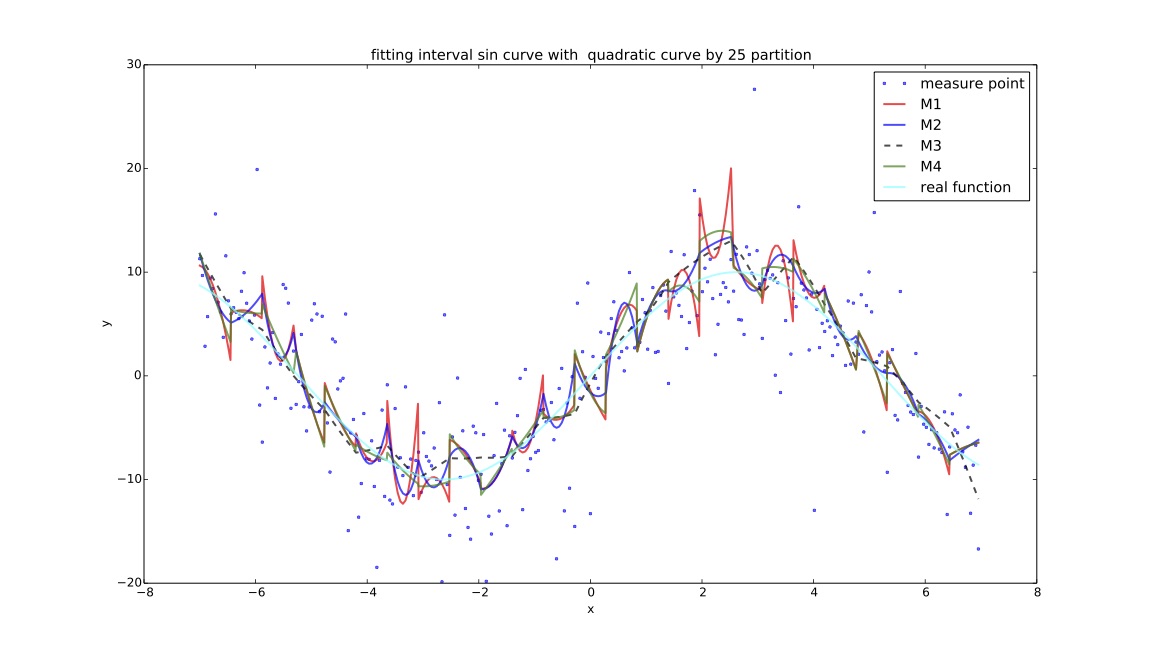
说明
目的: 为探讨在同一个样本点集下,cma-es算法对$f(x)$拟合效果与分段数的关系,实验记录每个分段方案下cma-es过程的迭代时间,关系矩阵变化过程,计算结果,cpu计算时间等进行对比。
函数:
评价函数:
- $M1$:分段测试函数的mse;
- $M2$:在f1基础上增加间断点连续性判断指标:$\sum_{i=1}^{k} (e^{\Delta Y_i-\alpha}-1)$,其中$\Delta Y_i$ 代表拟合分段函数在间断点处的左右间断点差的绝对值,$\alpha $默认代表$Y$值域范围的$1\%$大小;
- $M3$:在f2基础上增加间断点一阶导数评价指标:$\sum_{i=1}^{k}(e^{\frac{\Delta \sigma_i-\beta}{10e}}-1)$,其中$\Delta \sigma_i$代表左右间断点处的左右导数的$arctan$差的绝对值,$\beta$如未特殊说明全局默认为10度($\frac {\pi}{18}$);
实验
迭代次数与分段数关系图表
In [1]:
import makeData as md
%pylab inline
plt.rc('figure', figsize=(16, 9))
X=md.loadData('result.tl')
In [2]:
import numpy as np
import pandas as pd
b=[]
for i in range(5,35,5):
    temp=[]
    for j in range(3):
        temp.append(X[i][j]['iter'])
    b.append(temp)
bs=np.array(b).T
ind=range(5,35,5)
d={'M1':pd.Series(bs[0],index=ind),
   'M2':pd.Series(bs[1],index=ind),
   'M3':pd.Series(bs[2],index=ind)}
df = pd.DataFrame(d)
df.columns.name='function'
df.index.name='partition'
df
Out[2]:
In [3]:
df.plot(kind='bar',fontsize=20)
leg = plt.gca().get_legend()
ltext  = leg.get_texts()
plt.setp(ltext, fontsize='20')
plt.title("iteration counts",fontsize=16)
df.plot()
leg = plt.gca().get_legend()
ltext  = leg.get_texts()
plt.setp(ltext, fontsize='20')
plt.title("iteration counts",fontsize=16)
Out[3]:
cpu计算耗时与分段数关系图表
In [4]:
b=[]
for i in range(5,35,5):
    temp=[]
    for j in range(3):
        temp.append(X[i][j]['time'])
    b.append(temp)
bs=np.array(b).T
ind=range(5,35,5)
d={'M1':pd.Series(bs[0],index=ind),
   'M2':pd.Series(bs[1],index=ind),
   'M3':pd.Series(bs[2],index=ind)}
df = pd.DataFrame(d)
df.columns.name='function'
df.index.name='partition'
df
Out[4]:
In [5]:
df.plot(kind='bar',fontsize=20)
leg = plt.gca().get_legend()
ltext  = leg.get_texts()
plt.setp(ltext, fontsize='20')
plt.title("CPU time ",fontsize=16)
df.plot()
leg = plt.gca().get_legend()
ltext  = leg.get_texts()
plt.setp(ltext, fontsize='20')
plt.title("CPU time",fontsize=16)
Out[5]:


